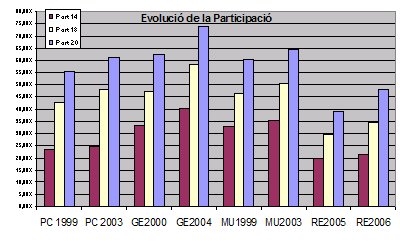
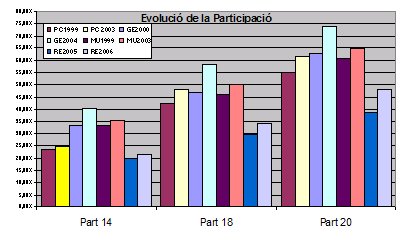
<%option explicit%> Ajuntament de Tortosa
Gene
Elec06
Comparativa Participació - Municipals
 
1995
1999
2003
2007
Meses:
36
 
39
 

40


45
 
Cens:
24.001
 
24.847
 

24.036


24.717
 
Votants:
15.308
63,78%
15.063
60,62%

15.541

64,69%

14.363 
58,11% 
Vots vàlids
15208
99.35%
14.451
95,94%

15.345

98,74%

6.187 
97,86% 
Vots a candid:
14.997
97,96%
14.112
93,69%

14.843

95,51%

5.789 
91,63% 
Vots en blanc:
211
1,38%
339
1.36%

502

2,09%

398 
1.61% 
Vots nuls:
100
0,65%
182
0,73%

192

0,80%

132 
0,53% 


Comparativa Participació - Parlament de Catalunya
 
1999
2003

2006

Meses:
39
 
40
 

45


Cens:
24.138
 
24.079
 

23.927 


Votants:
13.311
55,15%
14.771
61,34%

13.128 

54.87% 

Vots vàlids
13.248
99.51%
14.662
99,26%

12.864 

99.01% 

Vots a candidatures:
13.071
98,18%
14.337
97,06%

12.599 

96,98% 

Vots en blanc:
177
1,33%
325
2,20%

265 

2,04% 

Vots nuls:
65
0,49%
109
0,74%

128 

0,99% 

Comparativa Participació - Eleccions 1993-2006


Part 14h

Part 18h

Part 20h

MU 1995

8.885

37,04%

11.467

46,16%

15.308

63,82%

MU 1999

8.217

33,08%

11.790

49,12%

15.063

60,64%

MU 2003

8.534

35,53%

12.070

50,25%

15.541

64,69%

PC 1999

5.654

23,42%

10.255

42,48%

13.313

55,15%

PC 2003

5.963

24,77%

11.579

48,09%

14.771

61,34%

GE 2000

8.007

33,10%

11.354

46,94%

15.144

62,61%

GE 2004

9.676

40,21%

14.016

58,24%

17.756

73,79%

RE 2005

4.780

19,88%

7.087

29,47%

9.336

38,82%

RE 2006

5.128

21,49%

8.191

34,33%

11.488

47,91%

PC 2006
5.832
24,37%
9.931
41,51%
13.120
54,83%